RightMark Audio Analyzer test report
| Testing device | Astell Kern SE100 |
| Sampling mode | 24-bit, 44 kHz |
| Interface | |
| Testing chain | line-out |
| RMAA Version | 6.4.5 PRO |
| 20 Hz - 20 kHz filter | ON |
| Normalize amplitude | ON |
| Level change | -0.9 dB / -0.8 dB |
| Mono mode | OFF |
| Calibration singal, Hz | 1000 |
| Polarity | correct/correct |
Summary
| Frequency response (from 40 Hz to 15 kHz), dB | +0.06, +0.02 |
Excellent |
| Noise level, dB (A) | -120.6 |
Excellent |
| Dynamic range, dB (A) | 120.5 |
Excellent |
| THD, % | 0.00054 |
Excellent |
| THD + Noise, dB (A) | -100.3 |
Excellent |
| IMD + Noise, % | 0.00135 |
Excellent |
| Stereo crosstalk, dB | -94.8 |
Excellent |
| IMD at 10 kHz, % | 0.00099 |
Excellent |
| General performance | Excellent |
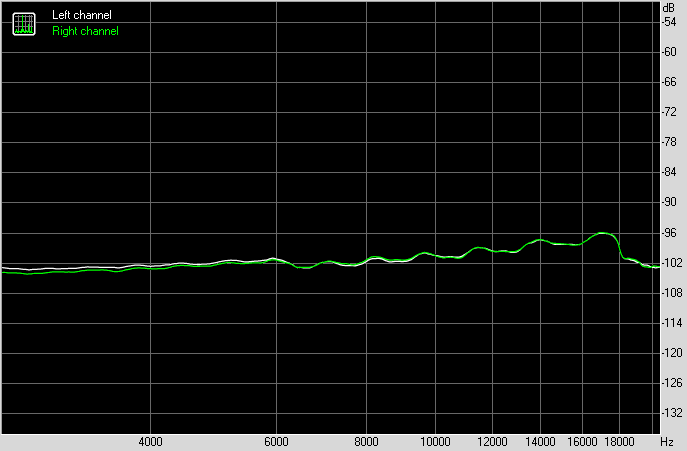
Frequency response
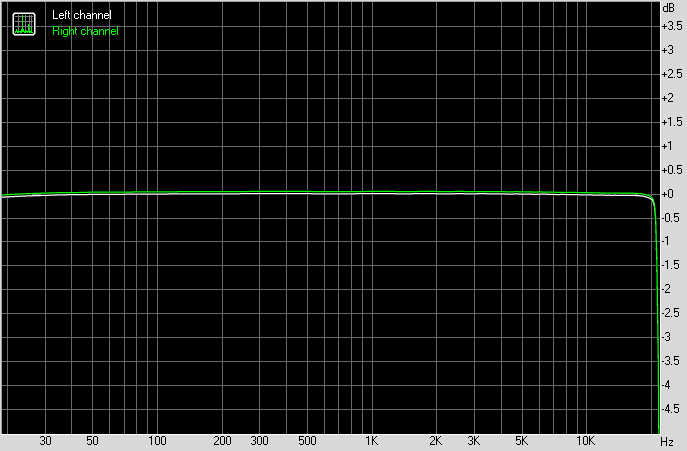
Left |
Right |
|
| From 20 Hz to 20 kHz, dB | -0.12, +0.01 |
-0.07, +0.06 |
| From 40 Hz to 15 kHz, dB | -0.03, +0.01 |
+0.02, +0.06 |
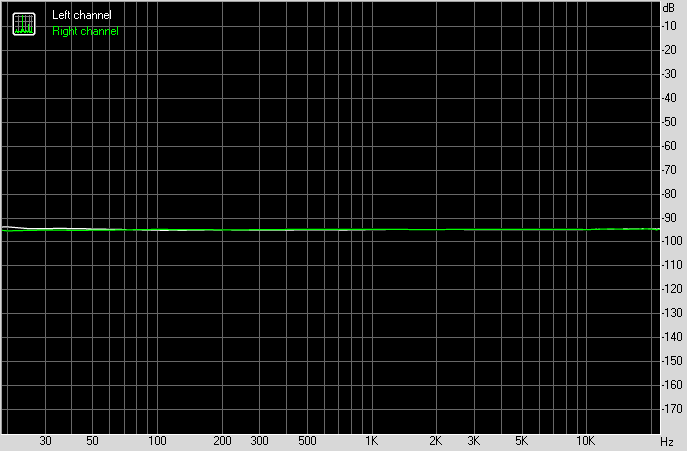
Noise level
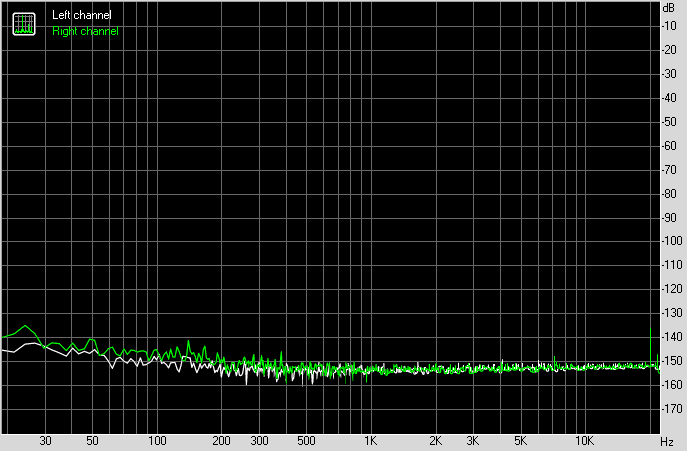
Left |
Right |
|
| RMS power, dB | -119.4 |
-119.0 |
| RMS power (A-weighted), dB | -120.7 |
-120.5 |
| Peak level, dB FS | -92.5 |
-92.4 |
| DC offset, % | +0.0 |
+0.0 |
Dynamic range
Left |
Right |
|
| Dynamic range, dB | +119.5 |
+119.0 |
| Dynamic range (A-weighted), dB | +120.6 |
+120.4 |
| DC offset, % | -0.00 |
-0.00 |
THD + Noise (at -3 dB FS)
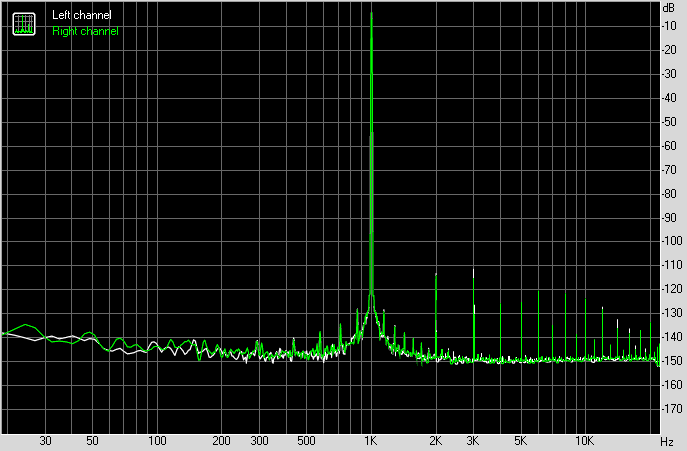
Left |
Right |
|
| THD, % | 0.00059 |
0.00048 |
| THD + Noise, % | 0.00087 |
0.00080 |
| THD + Noise (A-weighted), % | 0.00102 |
0.00091 |
Intermodulation distortion
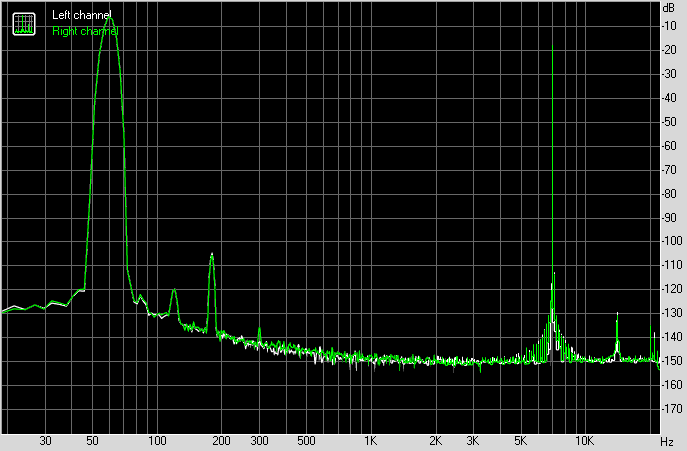
Left |
Right |
|
| IMD + Noise, % | 0.00139 |
0.00131 |
| IMD + Noise (A-weighted), % | 0.00071 |
0.00066 |
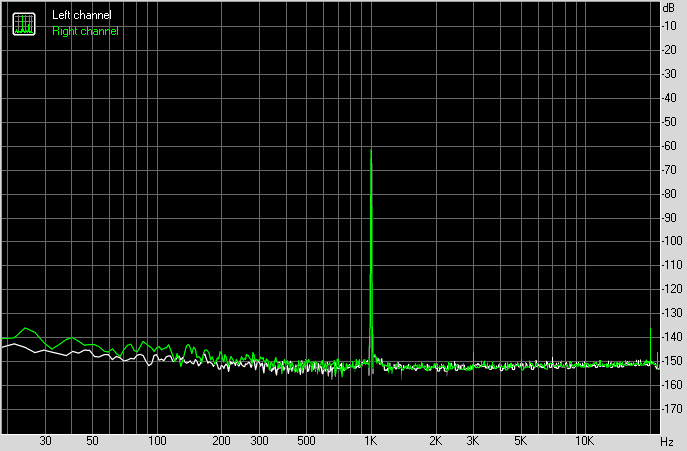
Stereo crosstalk
Left |
Right |
|
| Crosstalk at 100 Hz, dB | -94 |
-94 |
| Crosstalk at 1000 Hz, dB | -94 |
-94 |
| Crosstalk at 10000 Hz, dB | -94 |
-94 |
IMD (swept tones)
Left |
Right |
|
| IMD + Noise at 5000 Hz, | 0.00082 |
0.00078 |
| IMD + Noise at 10000 Hz, | 0.00094 |
0.00093 |
| IMD + Noise at 15000 Hz, | 0.00122 |
0.00124 |