RightMark Audio Analyzer test report
| Testing device | PreSonus Studio 26 Line out |
| Sampling mode | 24-bit, 44 kHz |
| Interface | ASIO |
| Testing chain | Lline out |
| RMAA Version | 6.4.2 PRO |
| 20 Hz - 20 kHz filter | ON |
| Normalize amplitude | ON |
| Level change | -0.1 dB / -0.1 dB |
| Mono mode | OFF |
| Calibration singal, Hz | 1000 |
| Polarity | inverted/inverted |
Summary
| Frequency response (from 40 Hz to 15 kHz), dB | +0.06, +0.02 |
Excellent |
| Noise level, dB (A) | -110.3 |
Excellent |
| Dynamic range, dB (A) | 110.3 |
Excellent |
| THD, % | 0.0055 |
Very good |
| THD + Noise, dB (A) | -82.6 |
Good |
| IMD + Noise, % | 0.0042 |
Excellent |
| Stereo crosstalk, dB | -101.0 |
Excellent |
| IMD at 10 kHz, % | 0.023 |
Good |
| General performance | Excellent |
Frequency response
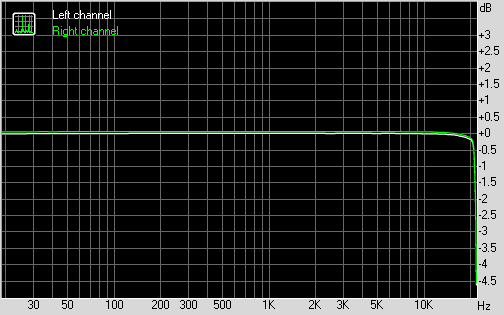
Left |
Right |
|
| From 20 Hz to 20 kHz, dB | -0.19, +0.00 |
-0.14, +0.06 |
| From 40 Hz to 15 kHz, dB | -0.04, +0.00 |
+0.02, +0.06 |
Noise level
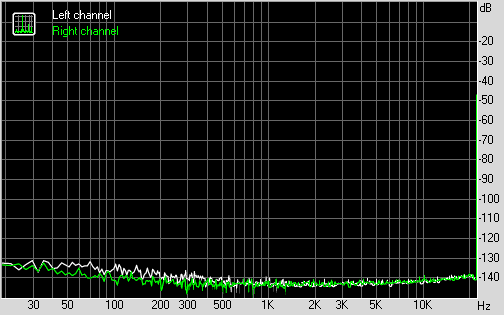
Left |
Right |
|
| RMS power, dB | -108.4 |
-108.6 |
| RMS power (A-weighted), dB | -110.3 |
-110.3 |
| Peak level, dB FS | -85.6 |
-85.6 |
| DC offset, % | +0.0 |
+0.0 |
Dynamic range
Left |
Right |
|
| Dynamic range, dB | +108.4 |
+108.5 |
| Dynamic range (A-weighted), dB | +110.4 |
+110.3 |
| DC offset, % | +0.00 |
+0.00 |
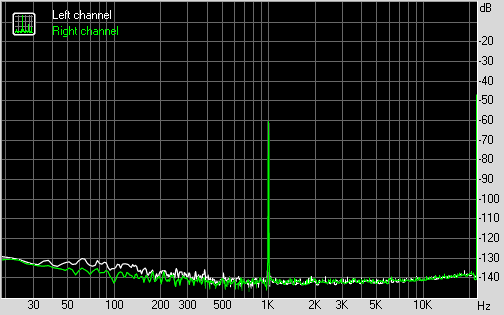
THD + Noise (at -3 dB FS)
Left |
Right |
|
| THD, % | +0.0052 |
+0.0058 |
| THD + Noise, % | +0.0053 |
+0.0059 |
| THD + Noise (A-weighted), % | +0.0070 |
+0.0078 |
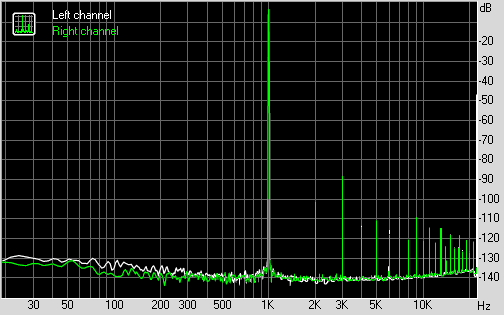
Intermodulation distortion
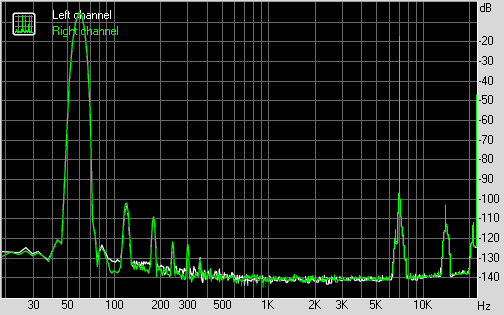
Left |
Right |
|
| IMD + Noise, % | +0.0042 |
+0.0042 |
| IMD + Noise (A-weighted), % | +0.0038 |
+0.0037 |
Stereo crosstalk
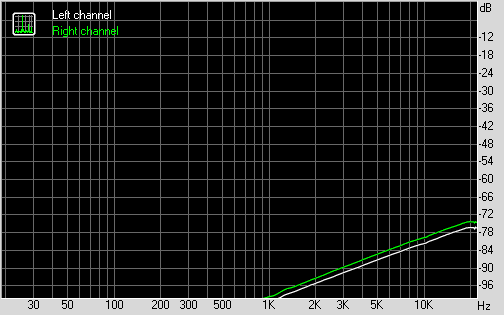
Left |
Right |
|
| Crosstalk at 100 Hz, dB | -108 |
-104 |
| Crosstalk at 1000 Hz, dB | -101 |
-99 |
| Crosstalk at 10000 Hz, dB | -81 |
-79 |
IMD (swept tones)
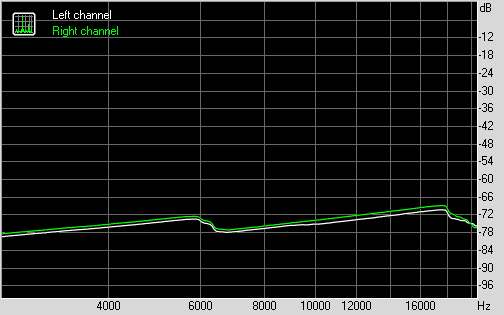
Left |
Right |
|
| IMD + Noise at 5000 Hz, | 0.0189 |
0.0211 |
| IMD + Noise at 10000 Hz, | 0.0175 |
0.0204 |
| IMD + Noise at 15000 Hz, | 0.0265 |
0.0310 |