RightMark Audio Analyzer test report
| Testing device | FiiO M15S |
| Sampling mode | 32-bit, 44 kHz |
| Interface | |
| Testing chain | line out |
| RMAA Version | 6.4.5 PRO |
| 20 Hz - 20 kHz filter | ON |
| Normalize amplitude | ON |
| Level change | -1.2 dB / -1.3 dB |
| Mono mode | OFF |
| Calibration singal, Hz | 1000 |
| Polarity | correct/correct |
Summary
| Frequency response (from 40 Hz to 15 kHz), dB | +0.01, -0.01 |
Excellent |
| Noise level, dB (A) | -121.1 |
Excellent |
| Dynamic range, dB (A) | 121.0 |
Excellent |
| THD, % | 0.00023 |
Excellent |
| THD + Noise, dB (A) | -108.0 |
Excellent |
| IMD + Noise, % | 0.00056 |
Excellent |
| Stereo crosstalk, dB | -85.7 |
Excellent |
| IMD at 10 kHz, % | 0.00056 |
Excellent |
| General performance | Excellent |
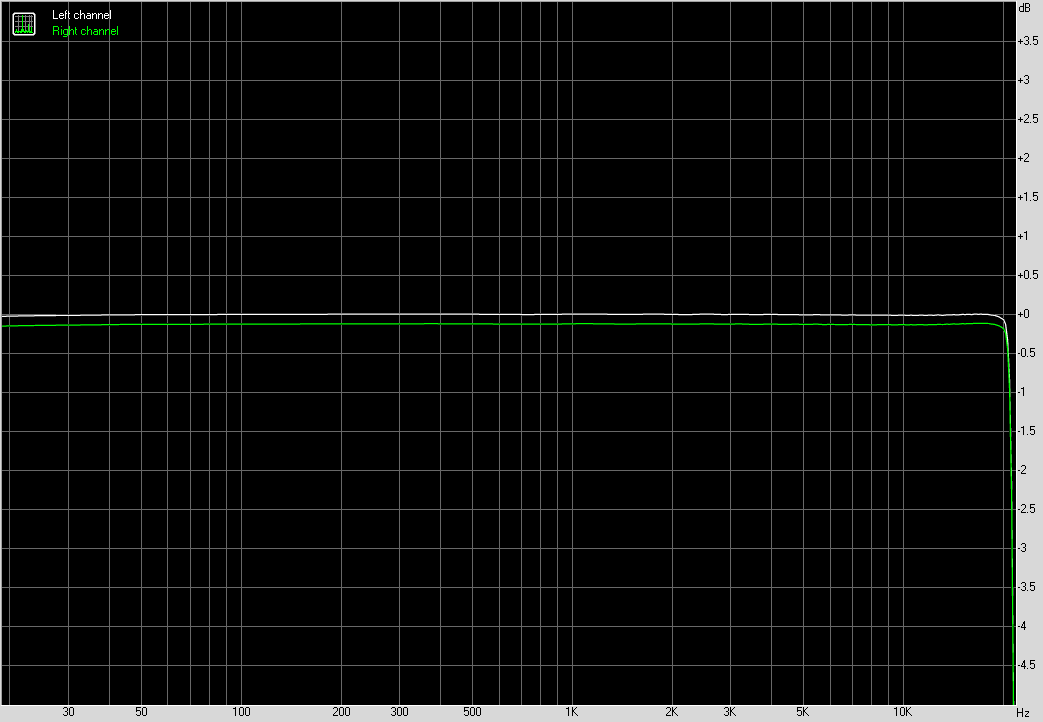
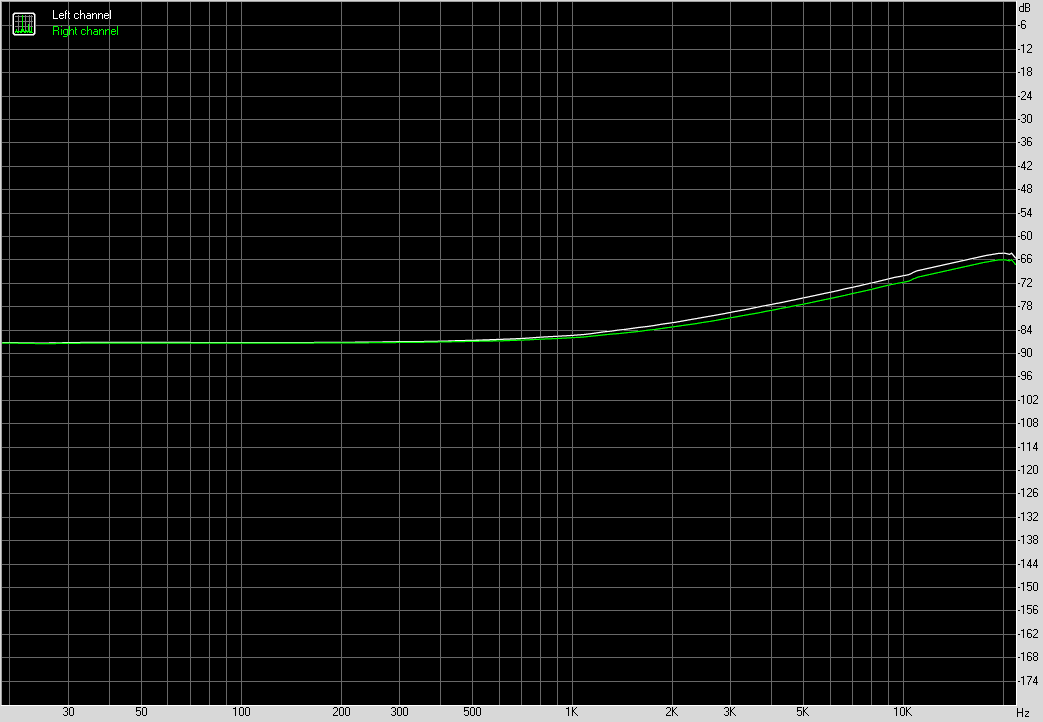
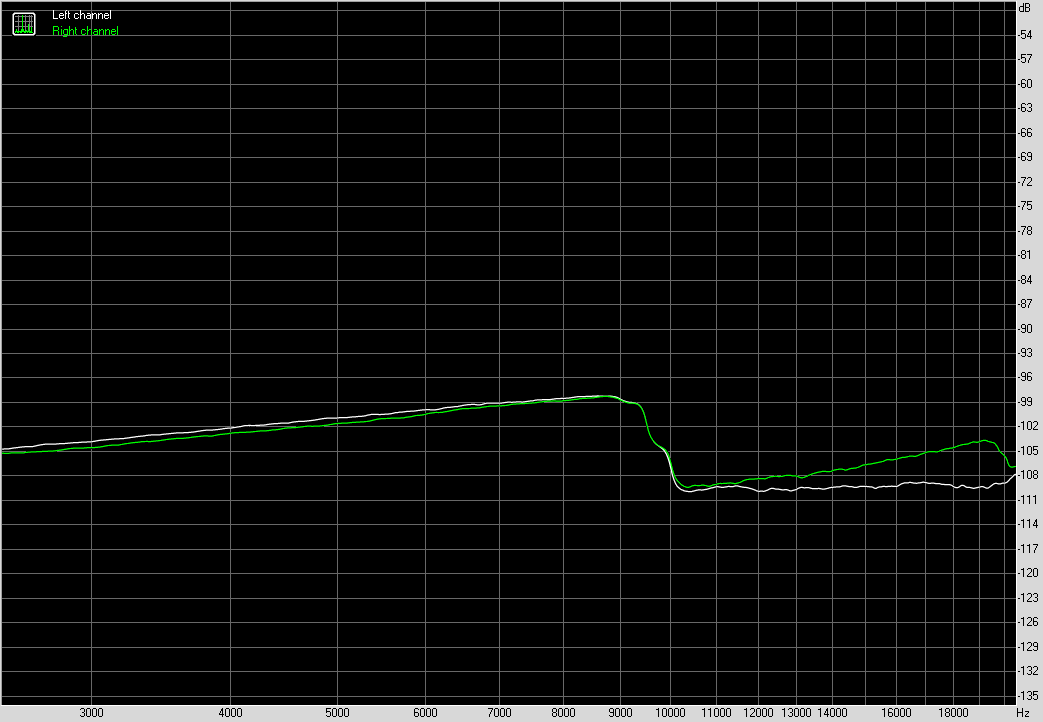
Frequency response
Left |
Right |
|
| From 20 Hz to 20 kHz, dB | -0.07, +0.01 |
-0.18, -0.11 |
| From 40 Hz to 15 kHz, dB | -0.01, +0.01 |
-0.13, -0.12 |
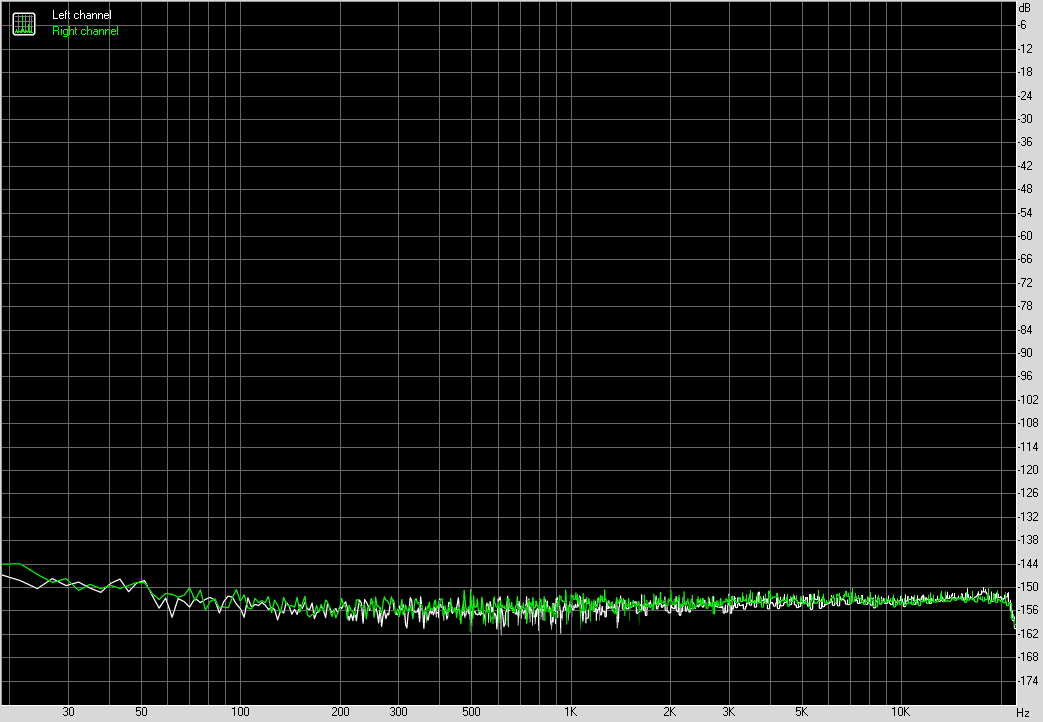
Noise level
Left |
Right |
|
| RMS power, dB | -120.0 |
-120.0 |
| RMS power (A-weighted), dB | -121.4 |
-120.9 |
| Peak level, dB FS | -92.5 |
-91.8 |
| DC offset, % | -0.0 |
+0.0 |
Dynamic range
Left |
Right |
|
| Dynamic range, dB | +119.9 |
+120.2 |
| Dynamic range (A-weighted), dB | +120.9 |
+121.1 |
| DC offset, % | -0.00 |
-0.00 |
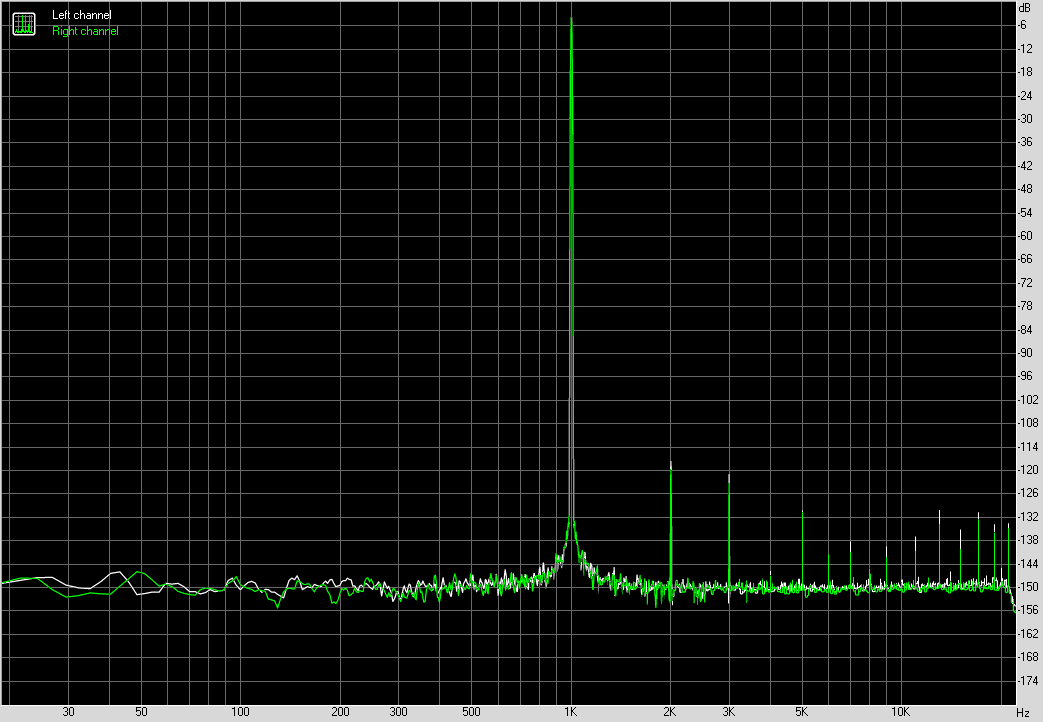
THD + Noise (at -3 dB FS)
Left |
Right |
|
| THD, % | 0.00025 |
0.00020 |
| THD + Noise, % | 0.00038 |
0.00035 |
| THD + Noise (A-weighted), % | 0.00042 |
0.00037 |
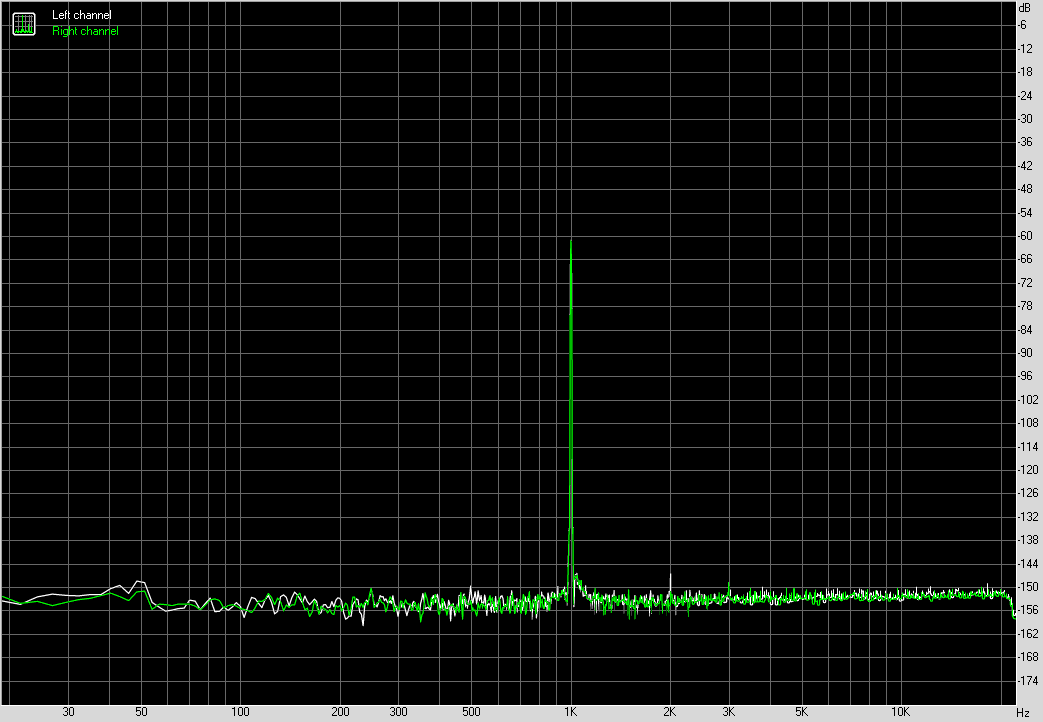
Intermodulation distortion
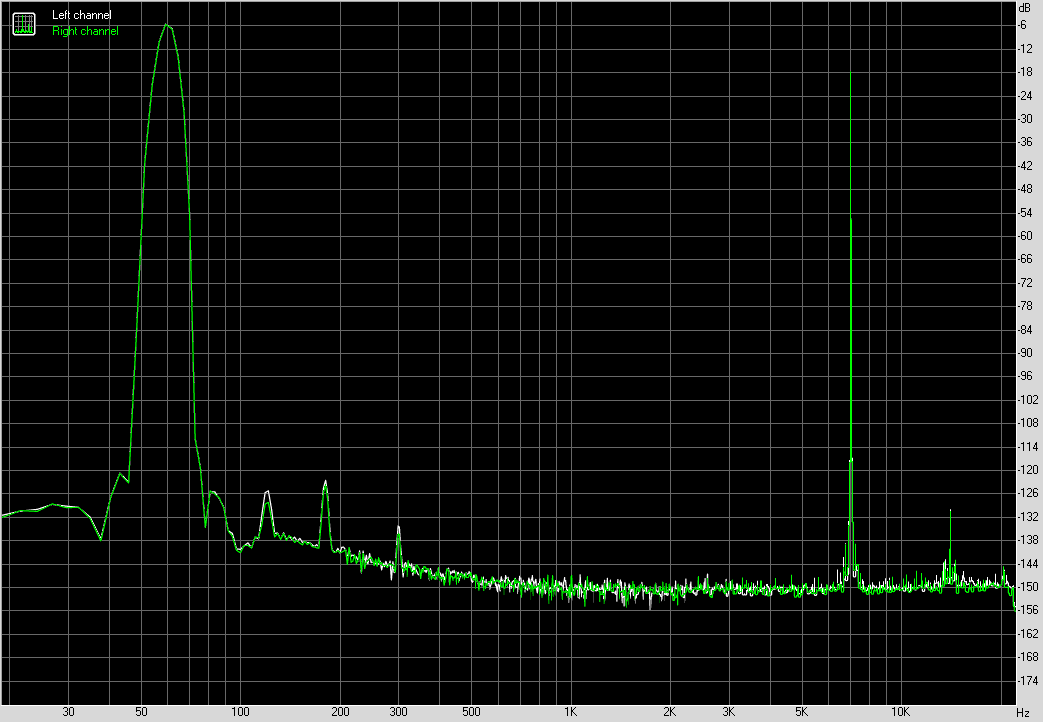
Left |
Right |
|
| IMD + Noise, % | 0.00058 |
0.00055 |
| IMD + Noise (A-weighted), % | 0.00046 |
0.00044 |
Stereo crosstalk
Left |
Right |
|
| Crosstalk at 100 Hz, dB | -86 |
-86 |
| Crosstalk at 1000 Hz, dB | -84 |
-85 |
| Crosstalk at 10000 Hz, dB | -69 |
-71 |
IMD (swept tones)
Left |
Right |
|
| IMD + Noise at 5000 Hz, | 0.00058 |
0.00055 |
| IMD + Noise at 10000 Hz, | 0.00058 |
0.00055 |
| IMD + Noise at 15000 Hz, | 0.00058 |
0.00055 |