RightMark Audio Analyzer test report
| Testing device | [ASIO] ASIO MADIface USB |
| Sampling mode | 24-bit, 44 kHz |
| Interface | ASIO |
| Testing chain | External loopback (line-out - line-in) |
| RMAA Version | 6.4.1 PRO |
| 20 Hz - 20 kHz filter | ON |
| Normalize amplitude | ON |
| Level change | -0.0 dB / -0.0 dB |
| Mono mode | OFF |
| Calibration singal, Hz | 1000 |
| Polarity | correct/correct |
Summary
| Frequency response (from 40 Hz to 15 kHz), dB | +0.04, -0.03 |
Excellent |
| Noise level, dB (A) | -118.8 |
Excellent |
| Dynamic range, dB (A) | 118.5 |
Excellent |
| THD, % | 0.0002 |
Excellent |
| THD + Noise, dB (A) | -109.4 |
Excellent |
| IMD + Noise, % | 0.0005 |
Excellent |
| Stereo crosstalk, dB | -119.2 |
Excellent |
| IMD at 10 kHz, % | 0.0006 |
Excellent |
| General performance | Excellent |
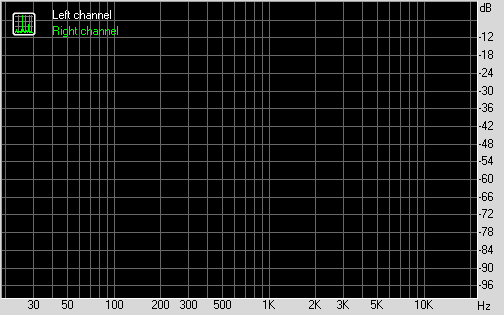
Frequency response
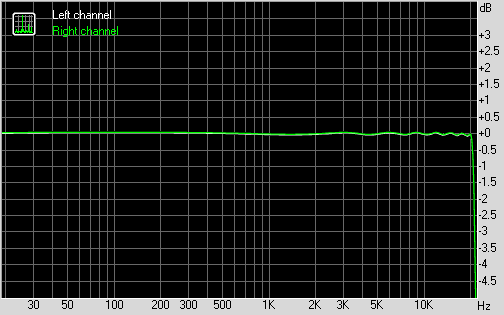
Left |
Right |
|
| From 20 Hz to 20 kHz, dB | -0.07, +0.02 |
-0.06, +0.04 |
| From 40 Hz to 15 kHz, dB | -0.05, +0.02 |
-0.03, +0.04 |
Noise level
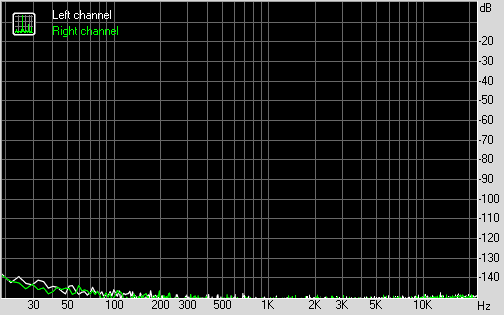
Left |
Right |
|
| RMS power, dB | -117.5 |
-117.5 |
| RMS power (A-weighted), dB | -118.8 |
-118.7 |
| Peak level, dB FS | -88.6 |
-88.6 |
| DC offset, % | +0.0 |
+0.0 |
Dynamic range
Left |
Right |
|
| Dynamic range, dB | +117.5 |
+117.4 |
| Dynamic range (A-weighted), dB | +118.6 |
+118.5 |
| DC offset, % | +0.00 |
+0.00 |
THD + Noise (at -3 dB FS)
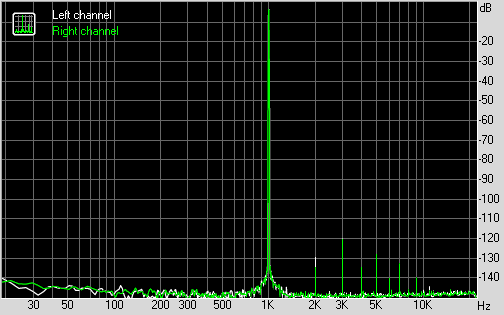
Left |
Right |
|
| THD, % | +0.0002 |
+0.0002 |
| THD + Noise, % | +0.0003 |
+0.0003 |
| THD + Noise (A-weighted), % | +0.0003 |
+0.0003 |
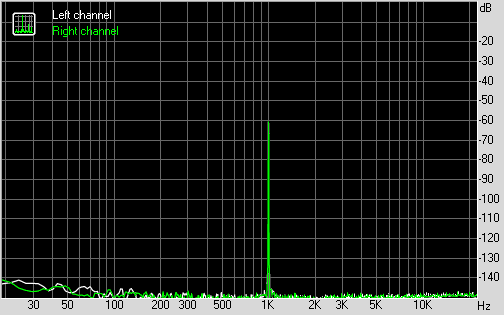
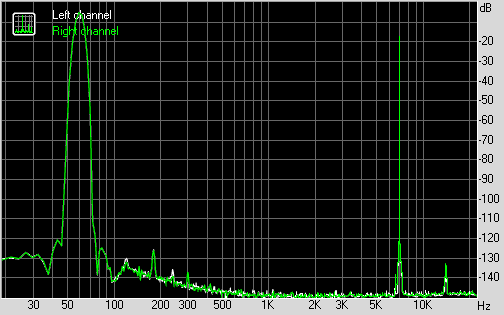
Intermodulation distortion
Left |
Right |
|
| IMD + Noise, % | +0.0005 |
+0.0005 |
| IMD + Noise (A-weighted), % | +0.0004 |
+0.0004 |
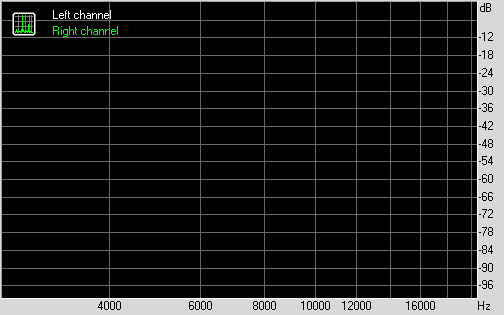
Stereo crosstalk
Left |
Right |
|
| Crosstalk at 100 Hz, dB | -113 |
-114 |
| Crosstalk at 1000 Hz, dB | -118 |
-118 |
| Crosstalk at 10000 Hz, dB | -116 |
-115 |
IMD (swept tones)
Left |
Right |
|
| IMD + Noise at 5000 Hz, | 0.0007 |
0.0007 |
| IMD + Noise at 10000 Hz, | 0.0005 |
0.0005 |
| IMD + Noise at 15000 Hz, | 0.0006 |
0.0007 |